Comparing, using a model...
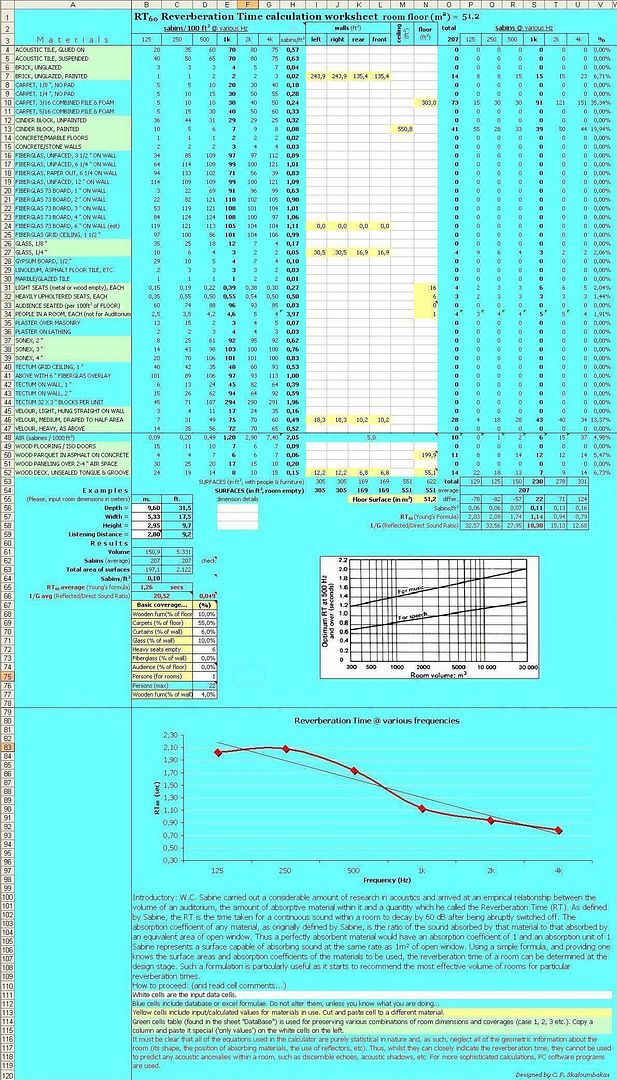
I have designed an excel sheet (model), putting the absorption coefficients of the most common material over certain frequencies and applying the simple formulas above, it gives an estimation of what the reverberation curve would look like. Following are just some examples to see if it works...
Example#1:
Let's try to justify why we prefer to put carpets and curtains and furniture in our room, for quality listening... (Most of the times it works and you don't need to put any extra exotic materials...). Let's assume a small to medium room of 28 sq. m, with a marble floor:
1. In the room there is only one listening seat and one person. No furniture, no carpets, no curtains nothing. Some glass windows are assumed. The result of the reverberation curve will be something like that:
RT(60) average=2.62, Reflected/Direct Sound Ratio=57.84 @ 2.33m. listening distance.
2. The same room has a carpet (55% of the floor) and curtains (to cover most of the glass) with still one listening seat and one person. The result of the reverberation curve will be something like that:
RT(60) average=1.14, Reflected/Direct Sound Ratio=25.11 @ 2.33m. listening distance.
3. The same room has a carpet and curtains and furniture this time (like libraries on the wall and wooden furniture on the floor), with 3 heavy seats and still one person. The result of the reverberation curve will be something like that:
RT(60) average=1.02, Reflected/Direct Sound Ratio=22.51 @ 2.33m. listening distance.
4. The same room as above with 11 persons as well (max allowed according to a rule of thumb). The result of the reverberation curve will be something like that:
RT(60) average=0.78, Reflected/Direct Sound Ratio=17.3 @ 2.33m. listening distance.
Example#2:
Let's try a similar comparison in a larger room (I would call it an average listening room) 9.6 x 5.3 x 2.95m. (LxWxH), with a 90% thick carpet coverage (rest is furniture, case 1) and no carpets at all (case 2), with a listening seat set @ 2.8m.:
1. RT(60) average=1.08, Reflected/Direct Sound Ratio=17.50
2. RT(60) average=1.73, Reflected/Direct Sound Ratio=28.12.
Example#3:
Something that is very essential to our listening satisfaction is the fact that in our rooms the reflected/direct sound ratio is very much larger than the ratio in a Concert Hall, which is something like 5 to 25, depending on the listening distance from the center of the orchestra.
See what's happening in a living room 9.6 x 5.3 x 2.95m. (LxWxH), at listening distances of 2m. and 4m. from the speakers respectively:
Doubling the listening distance, the direct sound (energy) gets 4 times less (not applicable for line array speakers...), although the reflected sound energy remains almost constant, so the ratio 1/G goes 4 times larger (from 10 and 40!)
The studies of Zahorik & Wightman (2001) and Zahorik (2002) have analyzed the above:
See now what's happening with the reverberation curve in an auditorium (@ 12 m. listening distance), how "smoother" things are (smaller inclination of the reverberation curve and less the dispersion from the mean value for the different frequencies).
By the way, take a look at the following:
- link
- link
- link
- link
Example#4:
Just to play a bit further, please compare the value of RT(60) and 1/G in the above auditorium with audience coverage of 99% and with audience coverage of 1%. This is also happening at home, if we listen with many people sitting and with no people in the room.
The above graphs and excel sheets and models and everything can only give an idea, if terrible things are happening in your listening room as far as reverberation time, ambiance and this sort of thing... The curves of the measurements shown are nearly textbook perfect, but in real life you often get "peaky", irregular shaped curves under the 100 Hz and towards the 20 Hz due to comb effect. They say NOTHING and DO NOT distinguish rooms that have parallel or nonparallel walls for example, which makes a hell of a lot of difference in listening, as you understand...
I would comment that according to those graphs, we could put any kind of acoustic material in his room, make the graphs really look straight and horizontal but still the room would remain acoustically HELL! And this is simply because this excel model says nothing about room dimensions and dimension ratios...
But it is not supposed to deal with that... There are civil engineers out there, who can build a better room for you...
Additional comments:
It has been proved by studies and experiments that the sound absorption coefficient and the Sabin units calculated for a given area, may be dramatically increased when the material is distributed on four different surfaces, in comparison with the coating on a single surface of that area. The fact is attributed to rim diffraction phenomena, connected with the increased of free edges of the material, resulting to a more extensive pseudo-coverage than the actual one.
This phenomenon also depends on the considered frequency. It is more evident at frequencies around 2000 Hz, minimizing at 700 and 8000 Hz of the frequency spectrum. The application however of the absorbent material so that it has areas of discontinuity, disperses the sound fronts, leading to an improvement of the diffusion field. Arches and concave surfaces are not desirable in the listening rooms, acting as acoustic "lenses" that focus the sound energy in specific locations, instead of spreading it out. This focus phenomenon is minimized as the curvature of the surface tends to level off.
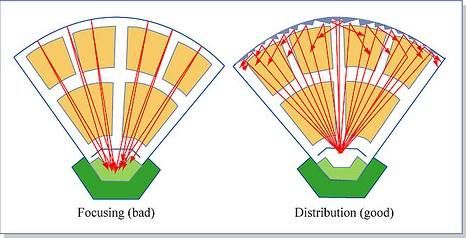
On the contrary, convex cylindrical surfaces of plywood or MDF etc have the opposite effect on the incident sound waves. Apart from the dispersible reflection, part of the sound energy may be absorbed (depending on composition), or even being re-emitted through stimulation of semi-cylindrical baffles within the listening room. A flat diaphragm would send the sound radiation at an angle range of 20 degrees in comparison to an equivalent cylindrical diaphragm, which has corresponding angles of sound radiation at around 120 degrees.
- link
This triple action is better achieved with the form of successive vertical semi-cylindrical sections to improve the acoustic behaviour of a room at low frequency components, calculated through a combination of absorbing and dissipating sound energy. Necessary conditions for their successful implementation are to have dimensions comparable to the wavelengths of sound which we want to disperse, and the asymmetrical arrangement of these cylinders within the study area.
The irregular structure reduces the possibility of the notched diffraction side effect and the resulting selective enhancement of specific frequencies - something that runs counter to the desired properties of a diffuser. The axes of symmetry of multi-cylinder encompassing groupings in different areas of the room must be vertical. The application of planar polygonal scattered clusters is less effective than the ones of poly-cylindrical section.
-